‘Edward Tufte is the revelatory retina of our time, ever connecting eye and brain in enlightening new ways. He creates masterpieces about design that are themselves masterpieces of design. Seeing with Fresh Eyes: Meaning, Space, Data, Truth takes all that he knows into a yet deeper level of wisdom and wider realm of inquiry. A completely delicious work.’-Stewart Brand, creator of the Whole Earth Catalog
Edward Tufte is a statistician & professor at Yale University, He is a statistician and expert on data visualisation, which Tufte’s work specialises in fields such as visual literacy & information design that deals with the visual communication of information. Tufte is against the idea of including decoration in his data visualisation and believes the ink should only cover the significant data and aid its interpretation.
He proposed several principles that I will be incorporating into my work, the 5 theories are as followed:
1. The use of colour
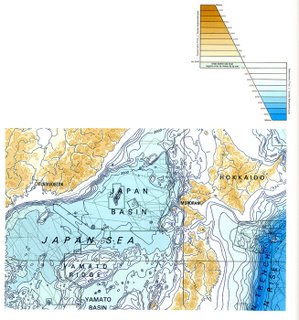
Figure 1 – mapping topography using shades of the same colour scheme, rather than a rainbow-colour legend, clear positioning and sizing of words 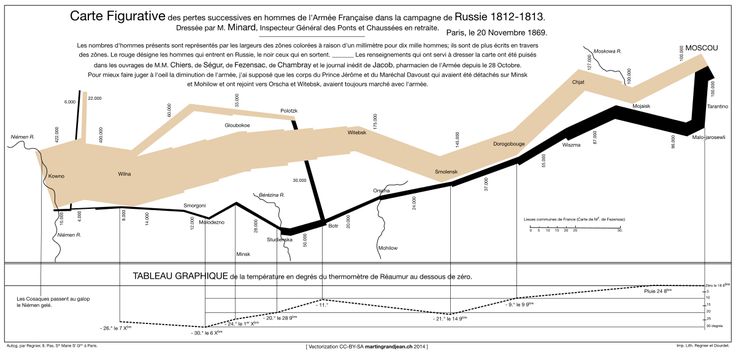
Figure 2- Napoleon’s March – the map begins on the left showing you the wide army band. As time progressed, you can see the the fewer amount of the army remain.
One of Tufte’s important principles for data visualisation is the use of colour. In Tufte’s graphs Colour is a powerful storytelling tool. Tufte states that colour is the main focus when conveying information, the use of colour avoids mishap. It is better to make the use of colour very clear rather then strive for great colours & designs. I am going to apply his theory into my design portfolio by using colour as a way of storytelling. I am not going to over- complicate the colours I use.
2. Small multiples encourage comparison
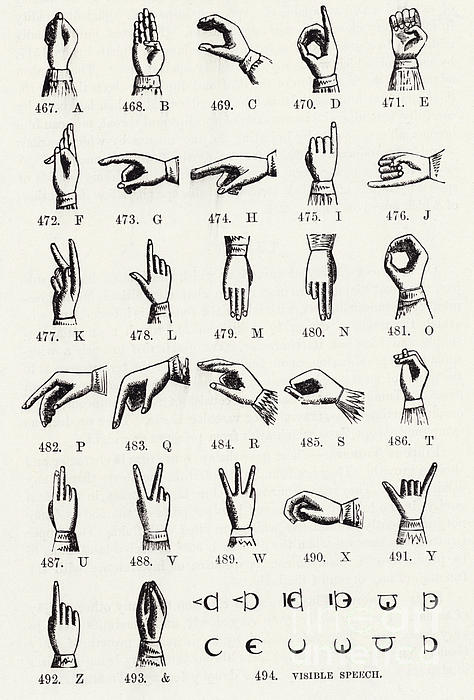
Figure 4 – An illustrated series of sign language. Each hand shows a different position per letter so each illustration varies from one another. 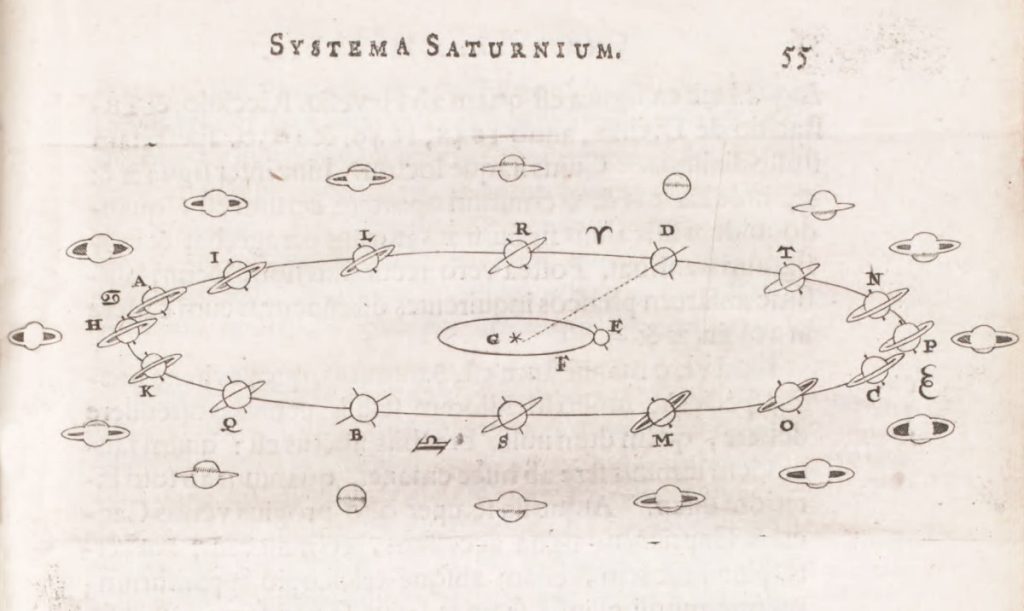
Figure 5 – Christiaan Huygens’ solar system ‘Systema Saturnium‘ (1659) showing why the appearance of Saturn’s ring changes as it orbits the sun
Tufte described a technique called ‘small multiples’. According to Tufte, small multiples reveal repetition & change, pattern & surprise. Small multiples visually depict comparisons, which helps the viewer analyse, differentiate & decide which reinforces the meaning of images. I have used small multiples with my storyboard I have made to create my planetary animation so I can create a guide visually to get from A to B.
3. Narratives of space & time
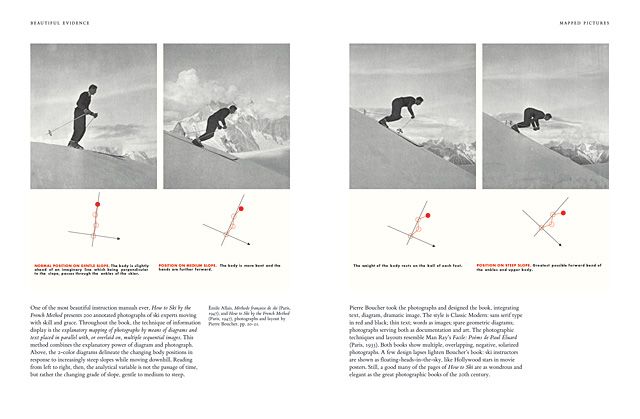
Figure 6- Shows instructions on the correct way to position yourself when skiing. 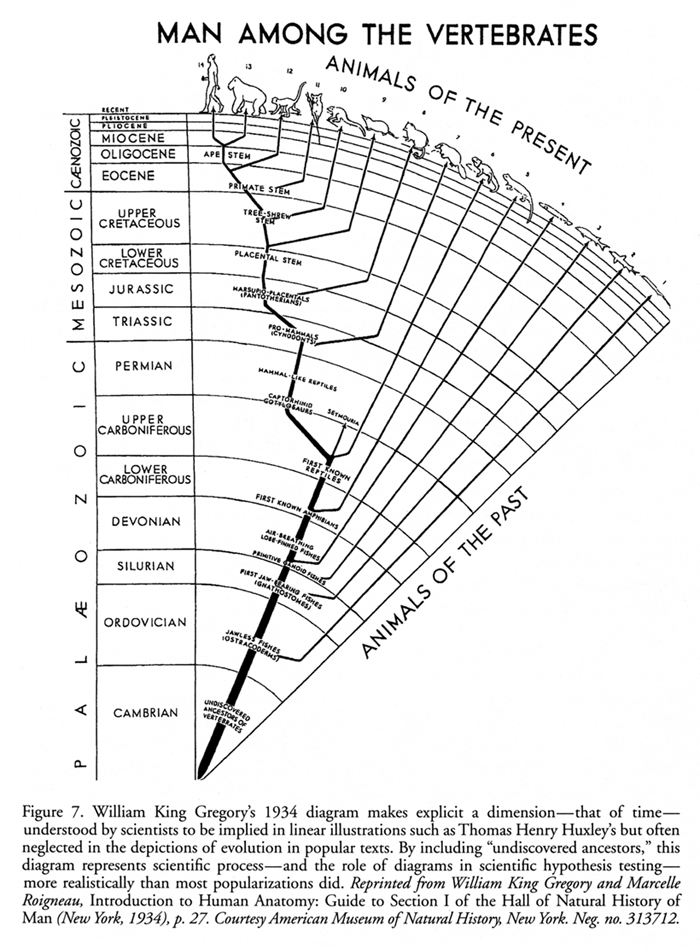
Figure 7 – ‘Man among the vertebrates’ (1934)This graph shows the evolution of human/animals
Tufte shows an example of space and time to show progression. I will be using this principle in my work by showing the progress of my animation over time so it makes more logical sense as it will be all in order.
4. Layering & Separation
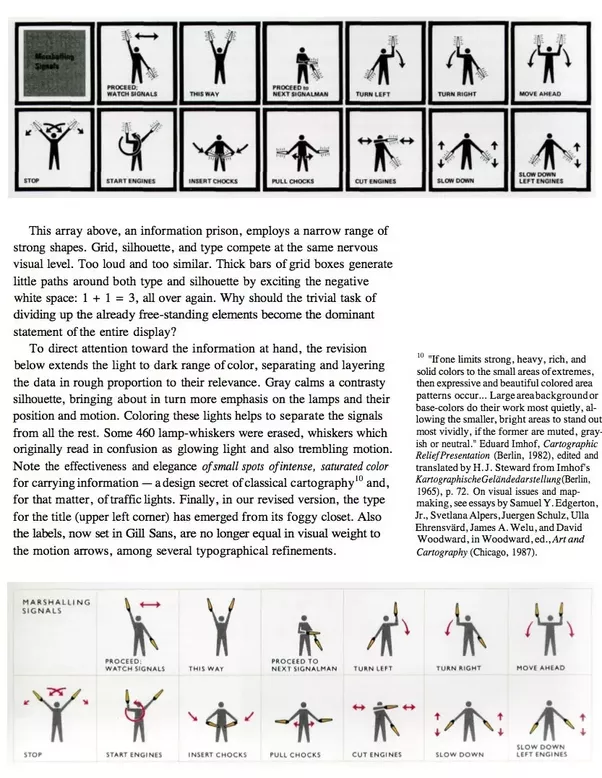
Figure 8 – Shows grids to instruct the viewer how to do aircraft marshalling signals with a grid layered. 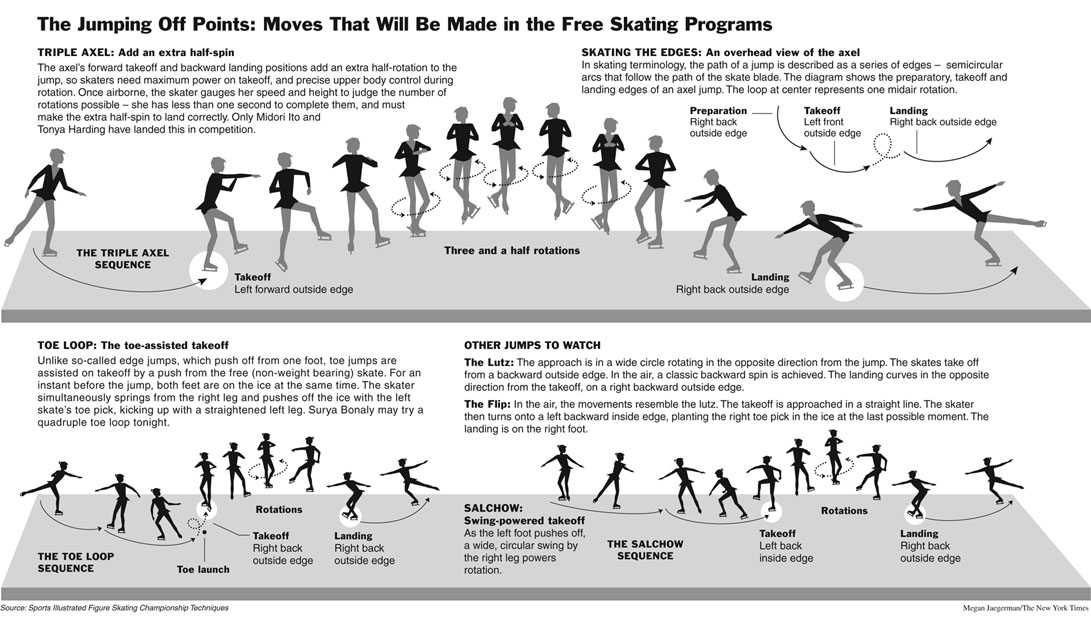
Figure 9 – Shows instructions on how to ice skate. there are separate images with each image being different and in order.
Tufte believes the importance of layering and separation. He believes supporting evidence should be visually separated, using a combination of light and colour. It is important the separate elements of a complex visualisation
5. Micro/Macro Readings
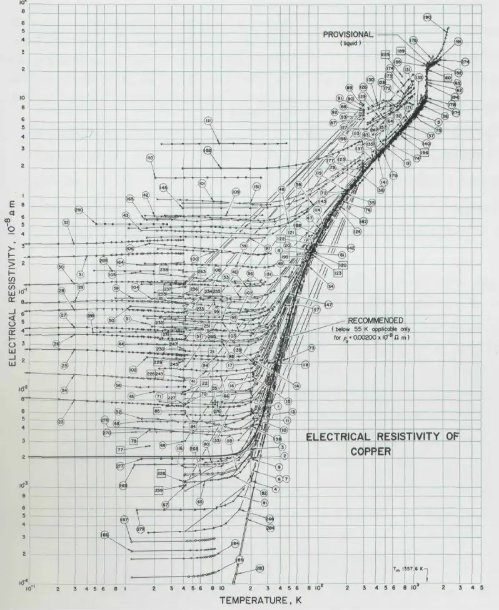
Figure 10 – Tufte, Edward R. 1986. The Visual Display of Quantitative Information shows small data points on the electrical resistivity of copper which creates a large display of data. 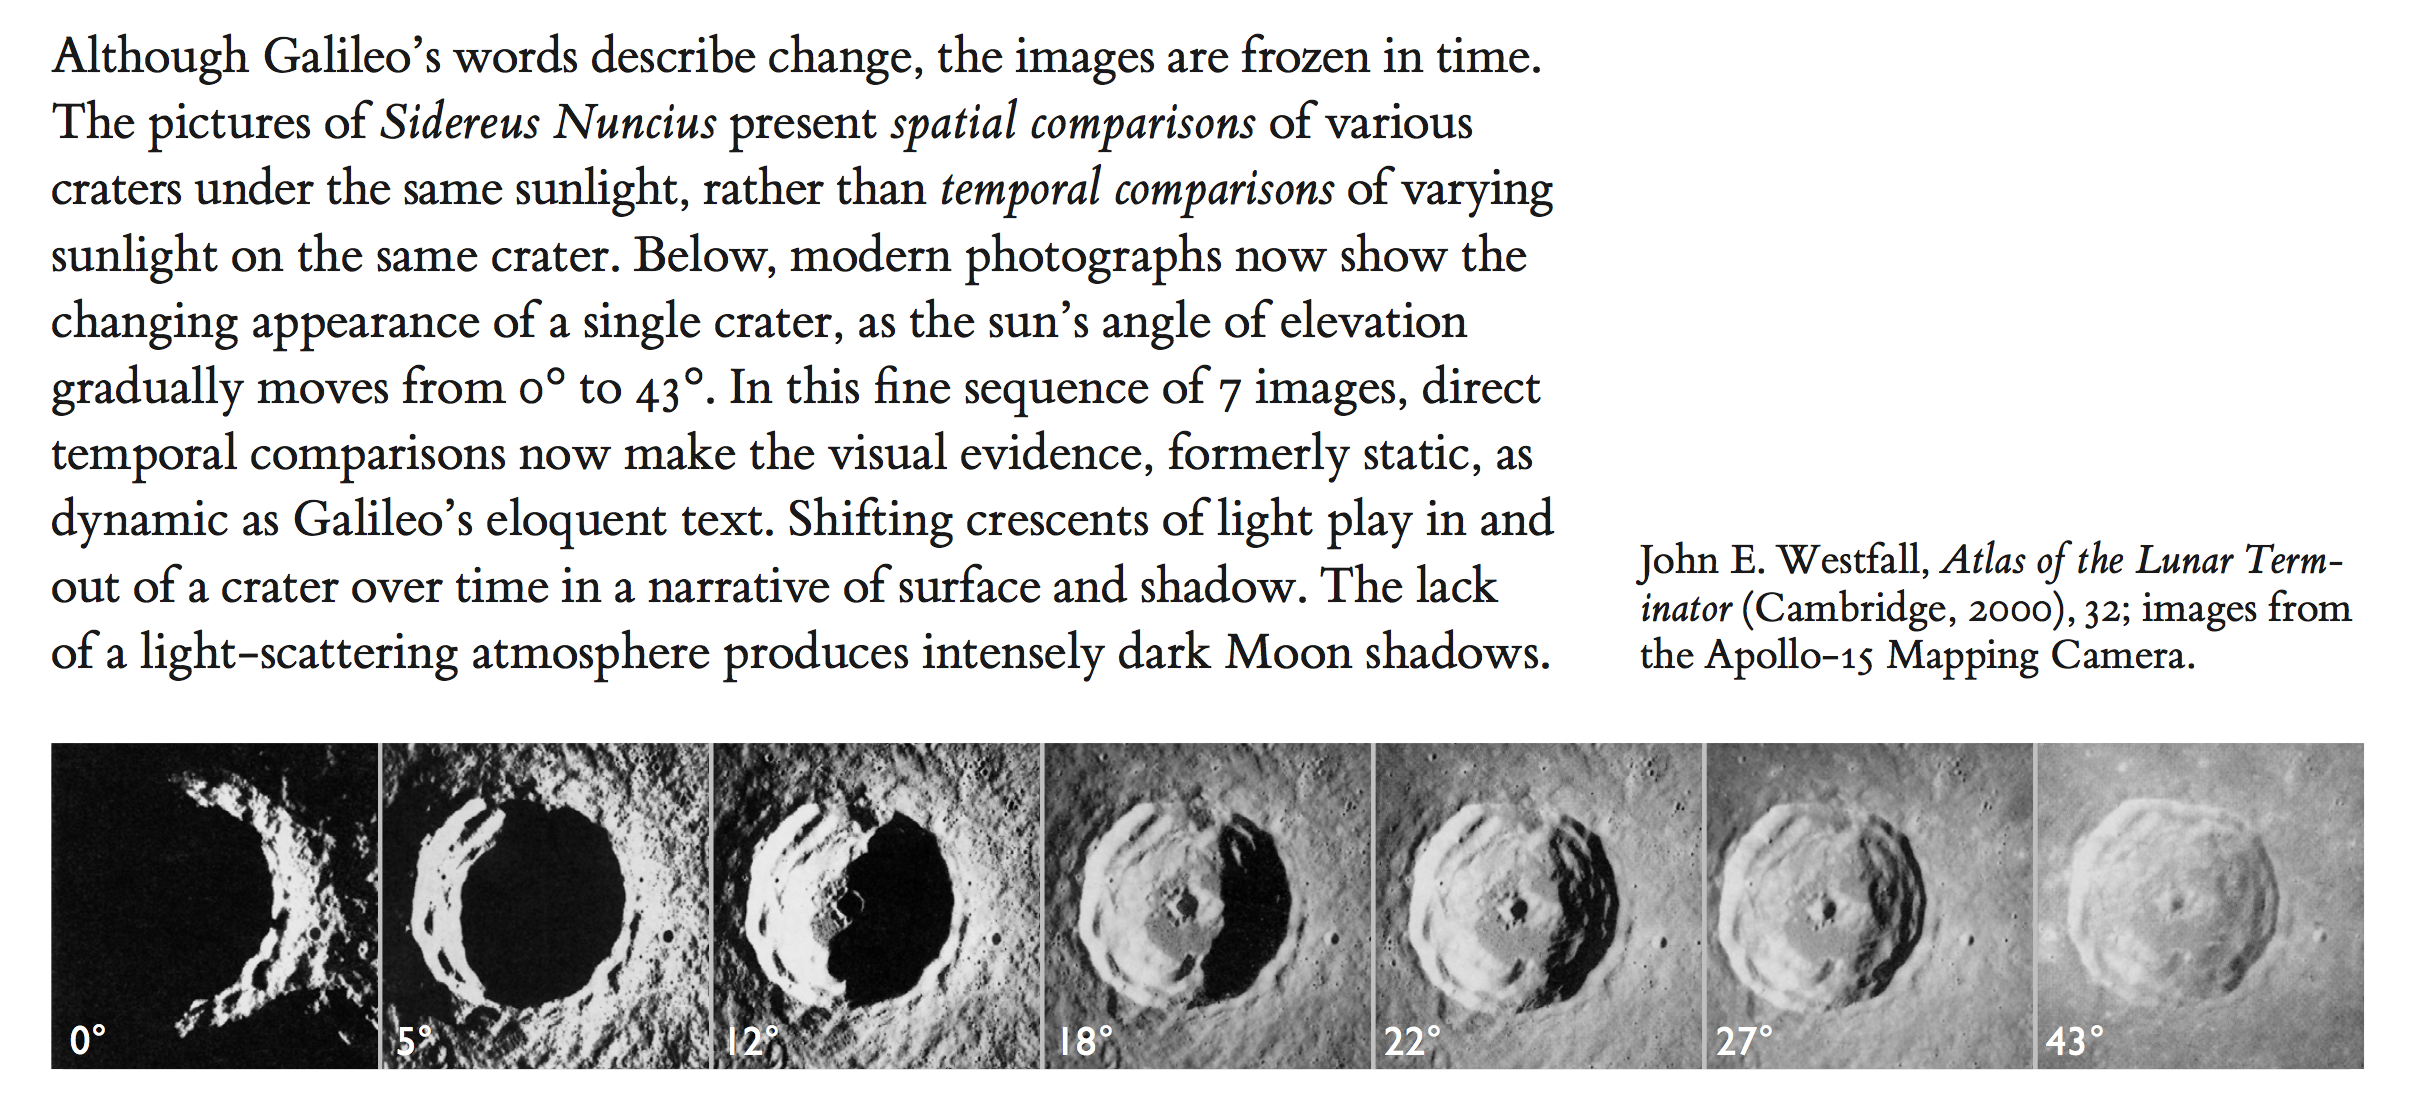
Figure 11 – John. E Westfall, Alas of the lunar terminator (Cambridge 2000) , 32 ;Images from the Apollo 15 mapping camera. Moon shadows are shown over time
The use of micro/ macro readings are important when conveying data and design ideas. Micro readings is an unconventional design strategy, to clarify and to add detail. Tufte refers micro/macro when he has multi-layered graphs, which are made up of large amount of data points but combined together display a larger order to the data.
References
admin. “Macro vs. Micro – What’s the Difference?” Writing Explained, 23 Feb. 2017, writingexplained.org/macro-vs-micro-difference#Summary. Accessed 16 June 2023.
Aldersey-Williams, Hugh. “The Uncertain Heavens: Christiaan Huygens’ Ideas of Extraterrestrial Life.” The Public Domain Review, 21 Aug. 2021,
publicdomainreview.org/essay/the-uncertain-heavens/. Accessed 15 June 2023.
CMS.633/833. “Edward Tufte: Color and Information.” Cms633.Github.io, cms633.github.io/Fall-2018/commentary/edward-tufte-color-and-information.html. Accessed 15 June 2023.
google.com. Pinterest, www.pinterest.co.uk/pin/203928689352911708/. Accessed 15 June 2023.
Julie. “Edward Tufte: The Da Vinci of Data.” Sites.psu.edu, 22 Feb. 2016, sites.psu.edu/julieludeman/2016/02/22/edward-tufte-the-da-vinci-of-data/. Accessed 15 June 2023.
schematron.org. “Edward Tufte Diagrams.” Wiring Diagram Pictures, 16 Jan. 2023, schematron.org/edward-tufte-diagrams.html. Accessed 16 June 2023.
Spring 2019, MSIS 2629. Chapter 2 Fundamentals | a Reader on Data Visualization. Mschermann.github.io, mschermann.github.io/data_viz_reader/fundamentals.html#ref-The-Visual-Display-of-Quantitative-Information. Accessed 16 June 2023.
STUDIO URBAN VOID. “STUDIO URBAN VOID – KUleuven Fall 2006.” STUDIO URBAN VOID, 8 2006, studiourbanvoid.blogspot.com/. Accessed 15 June 2023.
Team, Userpilot Content. “Micro and Macro Conversion Examples: Understanding the Difference.” Thoughts about Product Adoption, User Onboarding and Good UX | Userpilot Blog, 16 July 2022, userpilot.com/blog/micro-macro-conversion-examples/.
“The Work of Edward Tufte and Graphics Press.” Www.edwardtufte.com, www.edwardtufte.com/tufte/. Accessed 15 June 2023.
Walsh, Beth. “Exploring Edward Tufte’s Principles.” Data Viz School, 3 Apr. 2023, datavizschool.com/exploring-edward-tuftes-principles/. Accessed 16 June 2023.
render.fineartamerica.com/images/rendered/default/front/spiral-notebook/images/artworkimages/medium/1/1-sign-language-alphabet-english-school.jpg?&targetx=0&targety=-20&imagewidth=680&imageheight=1002&modelwidth=680&modelheight=961&backgroundcolor=F4F3EA&orientation=0&producttype=spiralnotebook . Accessed 15 June 2023.
sbt.blob.core.windows.net/storyboards/richardandrew/stop-motion2.png?utc=131540702148800000. Accessed 15 June 2023.
th.bing.com/th/id/R.32b5e65830247b4d7330253a9f9e2a2d?rik=IoYWGKMuxBWXIQ&riu=http%3a%2f%2fsites.psu.edu%2fjulieludeman%2fwp-content%2fuploads%2fsites%2f37566%2f2016%2f02%2fMinard.png&ehk=JnwMKHAnhf%2bTy%2bZcZco1bf16PpRKRTFTO4vxfsld1Oc%3d&risl=&pid=ImgRaw&r=0. Accessed 16 June 2023.
Quoracdn.net, 2023, qph.fs.quoracdn.net/main-qimg-f337de705aedb863a9b1815d1af601af. Accessed 16 June 2023.
schematron.org/image/edward-tufte-diagrams-6.jpg. Accessed 16 June 2023.Bing.com, 2023,
